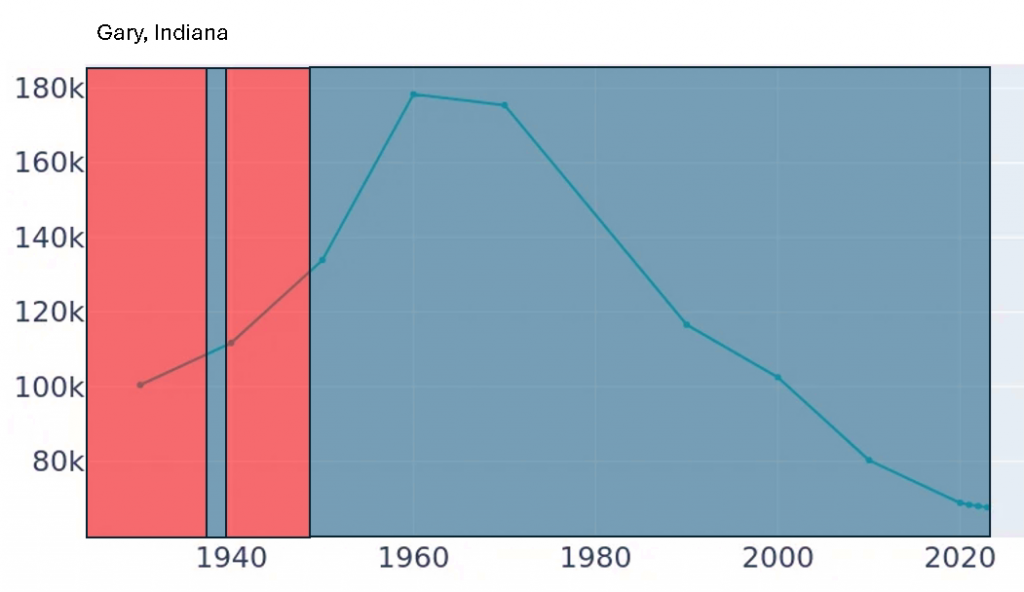
In the realm of urban economics, few places illustrate the full cycle of growth, political shifts, and decline as clearly as Gary, Indiana. Founded as an industrial hub, its rise and fall offer powerful insights into the impact of regulation, governance, and economic policy. By examining Gary, we can better understand similar patterns in major cities and states across the U.S., from California to Florida.

The Growth Phase: 1900–1940
Gary’s economic boom began in 1906 with the establishment of U.S. Steel Corporation. The company’s investment created a wave of jobs and population growth, driven by:
- Low Taxes and Minimal Regulations: Businesses thrived with minimal compliance costs.
- Population Surge: By 1930, Gary’s population grew to over 100,000 as workers flocked to new opportunities.
This period mirrors patterns seen in modern low-regulation environments like Florida and Texas, where business-friendly policies attract companies and residents alike. In Gary’s case, its laissez-faire climate made it a magnet for industrial growth.
The Tipping Point: 1940s–1960s
As Gary’s economy expanded, political and demographic shifts began to reshape governance:
- Increased Regulation and Stronger Labor Unions: Rising wages and stricter labor standards increased operating costs for companies.
- Political Shift to Democratic Leadership: Policies focused on social welfare and labor rights gained traction.
- Early Signs of Decline: Economic pressures mounted, but momentum from earlier decades sustained growth into the 1960s.
This phase mirrors cities like Denver and Austin, where rapid growth has attracted regulations that are now increasing costs for businesses and residents. These cities are at a tipping point, balancing economic dynamism with rising burdens.
The Decline: 1970s–1980s
In Gary, global competition and increased domestic regulations crushed the local steel industry:
- Environmental and Labor Laws: Compliance with the Clean Air and Water Acts required costly upgrades.
- Corporate Flight: Higher taxes and regulatory costs prompted businesses to relocate or shut down.
- Population Decline: By the 1980s, the population began a dramatic fall.
This pattern mirrors California, where stringent environmental policies and high taxes are driving both businesses and residents to states with friendlier regulatory environments.
Economic Collapse: 1990s to Present
Gary now stands as a stark reminder of unchecked decline:
- Population Shrinkage: Less than half its mid-century peak.
- Economic Decay: High crime, abandoned buildings, and a depleted tax base have made revitalization nearly impossible.
Today’s Chicago represents a similar late-stage decline. Despite attempts at rejuvenation, high taxes, burdensome regulations, and social issues continue to push businesses and people away.
Comparative Case Studies
| Region | Current Phase | Regulation Level | Outcome |
|---|---|---|---|
| Florida | Growth | Low | Business boom, rapid population growth |
| Texas | Tipping | Increasing | Slower growth in urban areas |
| Denver | Tipping | Rising | Affordability crisis, regulatory expansion |
| California | Decline | High | Mass business and resident outmigration |
| Chicago | Collapse | Very High | Shrinking population, high crime |
The Gary, Indiana Model
The cycle of growth, tipping point, and decline can be summarized:
- Low Regulation Fuels Growth: Business-friendly environments attract capital and talent.
- Success Attracts Political Change: A growing population brings new demands for social programs and regulation.
- Increased Costs Drive Decline: Regulation, taxes, and compliance burdens reduce competitiveness.
- Economic Collapse Follows: Businesses leave, populations decline, and cities struggle to recover.
Conclusion: A Cautionary Tale
Gary, Indiana, illustrates a predictable economic cycle repeated across U.S. cities. While low-regulation environments create short-term prosperity, over-regulation and political shifts can erode competitiveness. Striking a balance between economic freedom and social policy is critical to sustaining growth.
Understanding this cycle isn’t about partisan bias—it’s about learning from history. By recognizing these patterns, policymakers and citizens can make informed choices that shape the future of their cities and economies.
Republicans have less regulations which allow economies to grow
Democrats impose regulation which cause economies to fail